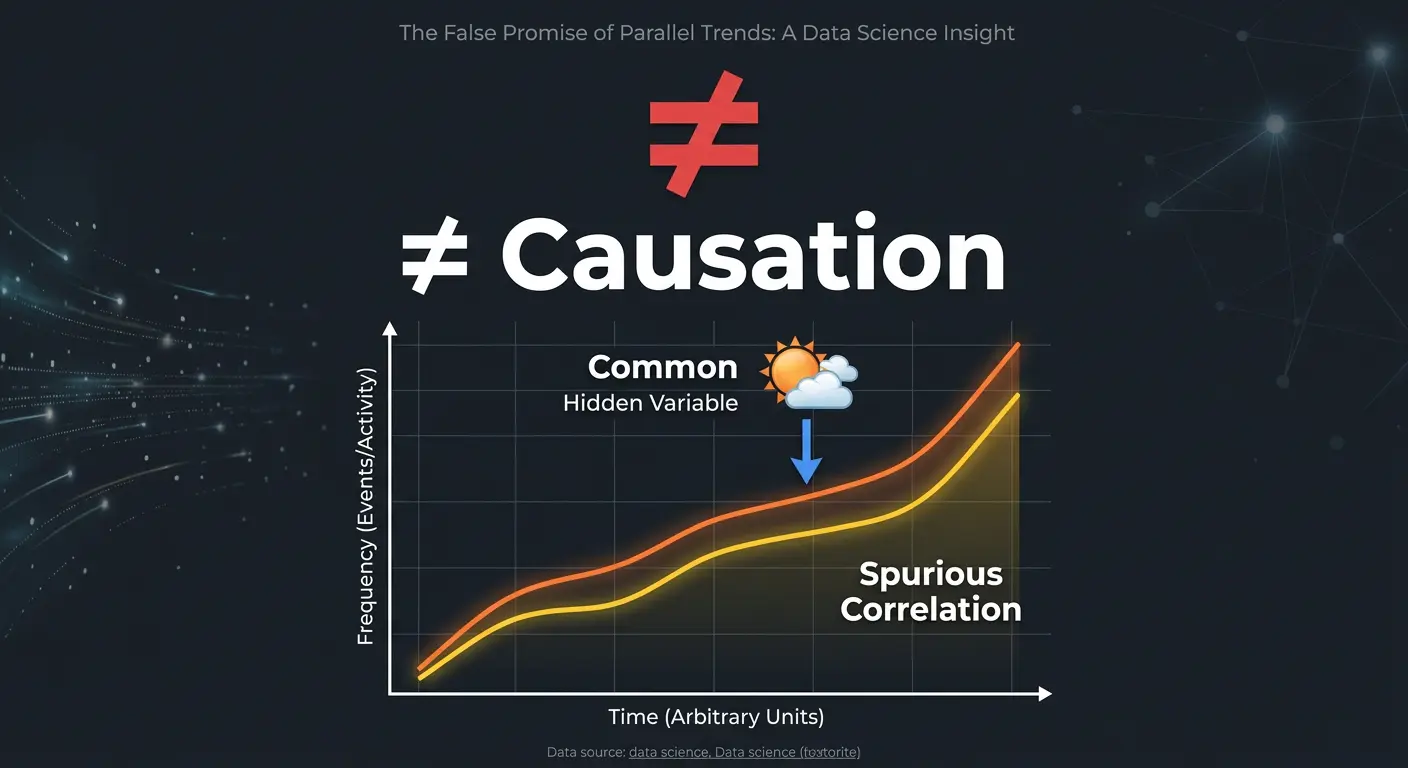
One of the most consequential mistakes in data analysis is confusing correlation with causation. Two variables can move together perfectly and still have no causal relationship. Understanding causality in data is one of the most practically valuable skills in applied analytics, and it is central to effective analytics and BI strategy.
What Is Causality Data?
Causality data refers to information that helps establish a cause-and-effect relationship between variables. It goes beyond identifying that two things occur together. It demonstrates that one variable directly produces a change in another.
While correlation tells us what is happening, causality tells us why. The distinction is not academic. It determines whether business interventions will actually work or simply waste resources.
The fundamental principle: Correlation does not imply causation. Two variables may be perfectly correlated while being independently driven by a confounding variable.
Four Examples That Make the Distinction Clear
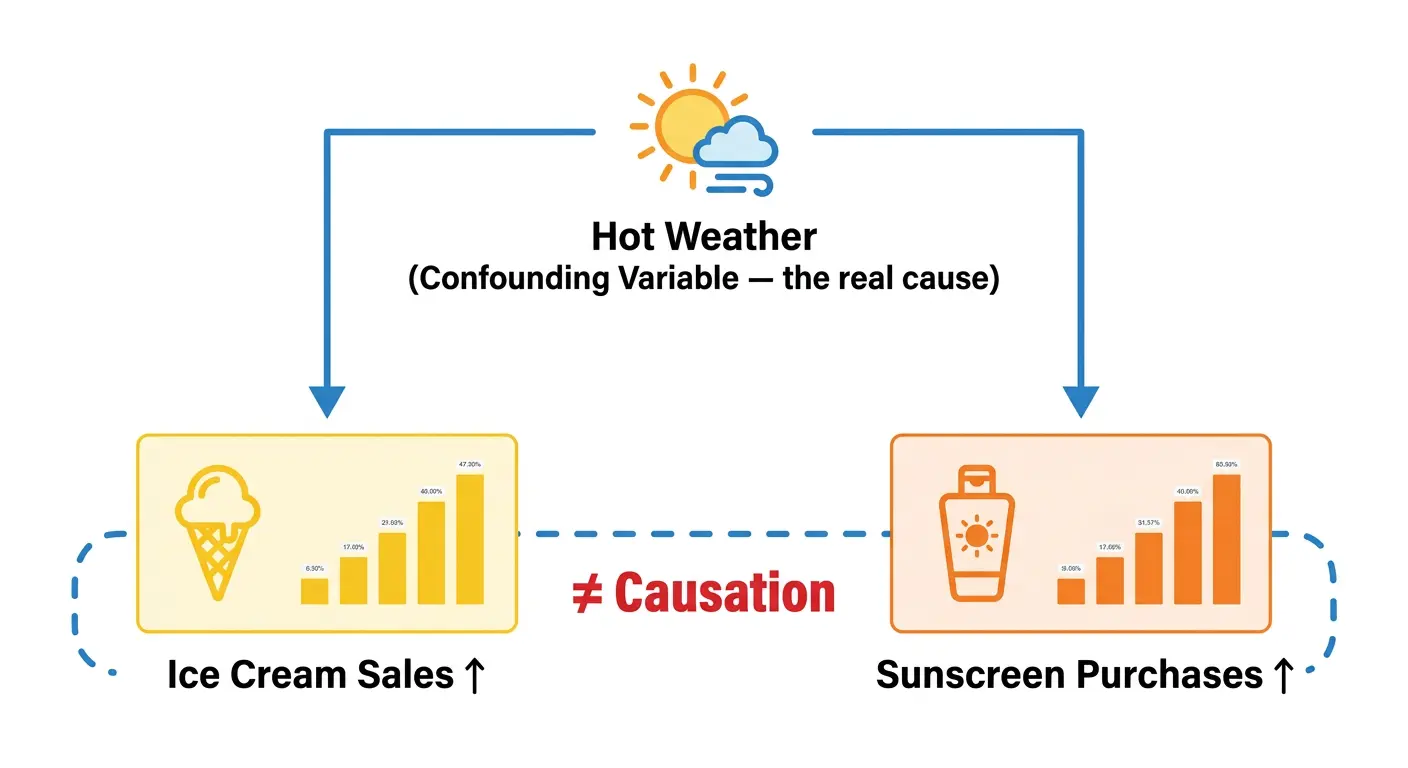
Example 1: Ice Cream Sales and Sunscreen Purchases
Observation: Ice cream sales and sunscreen purchases both increase during summer months. The correlation is strong and consistent year after year.
Wrong conclusion: Buying ice cream causes people to buy sunscreen (or vice versa).
Real explanation: Hot weather is the confounding variable. It independently drives both ice cream sales and sunscreen purchases. Remove the heat, and both decline, regardless of each other.
Example 2: Studying and Exam Performance
Observation: Students who study more hours tend to score higher on exams.
The question: Does more studying cause higher scores, or do naturally diligent students both study more and perform better due to underlying traits like discipline, motivation, or prior knowledge?
Without controlling for these confounding factors, the causal claim remains unproven, even though the correlation is real.
Example 3: Fertiliser and Plant Growth
Setup: A controlled experiment where identical plants are divided into two groups. One receives fertiliser, the other does not. All other conditions (light, water, soil) are held constant.
Result: The fertilised group grows significantly more. Because the experiment isolated the fertiliser as the only variable, this is a genuine causal relationship confirmed through experimental design.
Example 4: Exercise and Weight Loss
Observation: People who exercise regularly tend to weigh less.
The complexity: Weight change is influenced by diet, metabolism, genetics, sleep quality, stress levels, and many other factors. Simply observing that exercise correlates with lower weight does not prove exercise causes weight loss. You need to isolate exercise’s specific contribution while controlling for everything else.
How to Establish Causal Relationships in Data
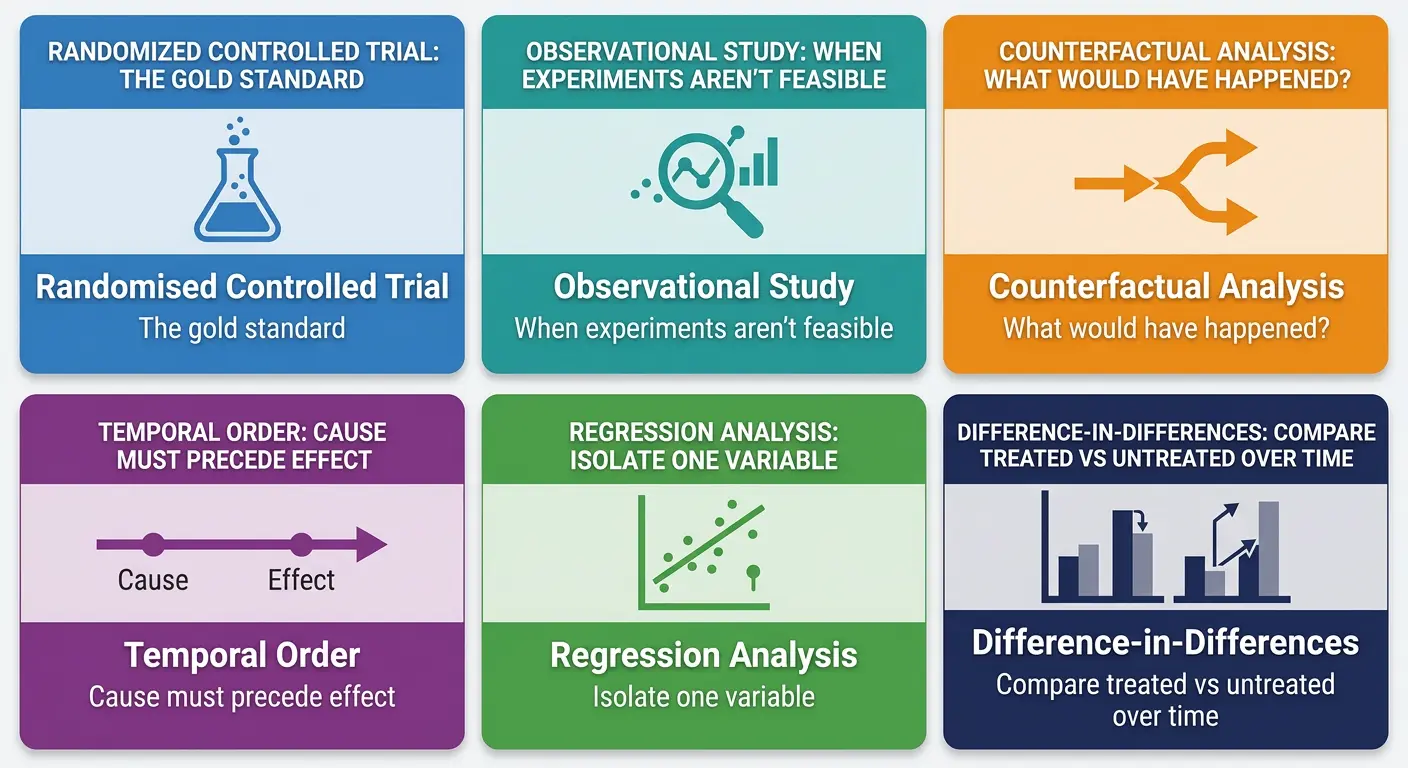
Establishing causation requires methodological rigour. The following methods range from experimental (strongest evidence) to observational (requires more statistical control):
| Method | Use Case |
|---|---|
| Randomised Controlled Trials | Gold standard. Random assignment eliminates confounding variables |
| Observational Studies | When experiments are not feasible. Requires careful statistical control |
| Counterfactual Analysis | Compare actual outcomes to “what would have happened” without the intervention |
| Temporal Ordering | Confirm cause precedes effect in time. Necessary but not sufficient |
| Regression Analysis | Isolate one variable’s effect while controlling for others |
| Difference-in-Differences | Compare treated vs untreated groups over time to measure intervention effect |
| Propensity Score Matching | Simulate randomisation from observational data by matching similar subjects |
The Business Impact: Why This Matters in Practice
The correlation-causation distinction is not theoretical. It has direct financial and strategic consequences across every business function:
- Marketing: Does a loyalty card programme drive higher customer value, or does it simply identify customers who were already high-value? If the latter, expanding the programme will not increase revenue.
- Product: Does Feature X cause higher user retention, or do engaged users simply use more features? Building more features like X will not help if engagement is the real driver.
- People and talent: Does a training programme cause improved performance, or do high performers self-select into training? Without causal evidence, the training budget may be misallocated.
In each case, acting on correlation alone leads to wasted investment. Establishing causation ensures resources target the actual drivers of outcomes. A strategic advisory engagement can help leadership teams build the analytical rigour needed to distinguish correlation from causation in their data-driven decisions.
Three Questions Before Making a Causal Claim
Before asserting that one variable causes another, every analyst and decision-maker should ask:
- Is there a plausible mechanism? Can you explain how A would cause B? If no logical mechanism exists, the correlation is likely coincidental or driven by a confounding variable.
- Does A precede B in time? A cause must occur before its effect. If the timeline does not support this, the causal claim fails.
- Have confounding variables been controlled? Have you identified and accounted for other factors that could independently drive both A and B?
If any of these three questions cannot be answered affirmatively, the causal claim should not be made.
Correlation is easy to find. Causation is hard to establish, and enormously valuable when you do. The question is never just “what correlates with our outcome?” The question is: “what actually drives it?”
This pairs directly with understanding inference in data science, where drawing valid conclusions from observed data is the core challenge.

Need rigorous analytics that move beyond correlation?
Your Partner Technologies helps analytics teams build the methodological rigour for actionable causal insight.
Get in Touch →